
SLOs: You’ve Got Questions, We Did Our Best To Answer Them

Before we get into addressing all of the awesome questions we got during the webinar, I want to start by saying thank you to everyone who attended, and an extra thank you for being so interactive!
We received a lot of great questions that I wish we really had the time to dive more deeply into or even get to address in the first place. Hopefully this post helps to answer your questions and provide even more detail than we were able to cover on the webinar.
If you have any further questions, please get in contact with us!
If there are multiple components as part of a user journey, do you setup SLOs at the customer frontend component, across each component, or is it a combination of both?
The short answer is that you should definitely do a combination of both. Now, if someone said “go create one SLO right now” and we had to pick from monitoring the frontend or backend, I would always start with the frontend. The frontend is ultimately a reflection of the customer experience and if we are trying to tell the story of how a user experiences our site, this is the obvious place to start.
Generally speaking, issues with the backend will reflect in frontend metrics. More specifically speaking, that isn’t always true, especially if we are measuring calls to services that are asynchronous or don’t directly affect the user experience directly (at least, as far as they can tell). For example, if we accept a customer order and they receive a success message, we haven’t directly impacted the customer's experience. However, if that order lands in a queue and takes a while to process resulting in an order confirmation email not being sent in a “timely” manner, that can affect customer satisfaction. If a customer isn’t satisfied, they may not return. There are plenty of other examples of this kind of thing, but ultimately, this is why we absolutely want to understand both the frontend and backend.
While SLOs are meant to be collaborative in nature, when push comes to shove, who typically should have the final say in an organization?
This is always a fun one, and I’m bound to ruffle some feathers here (but hey, we were already pushing and shoving, right?) - but I’m going to default to saying that engineering has the final say. While the cynic in me wants to say that this is because the business sets unrealistic expectations, the reality is really more that engineering typically has a better idea of what they can accomplish based on their understanding of the infrastructure and application.
If there is pushing and shoving, the final say should also come with a compromise of some sort; maybe engineering says “we can confidently hit a 98% success rate and with time allocated to do the work we can hit 99% in a short period of time, however we cannot hit 99.9999% without additional research and investigation”. Remember, SLOs mean shooting for a common language, and part of a common language is two entities understanding each other. If push comes to shove and you can make a decision with caveats and next steps, that is typically the best outcome; you are inherently building trust and understanding through data and both trust and understanding are incredibly important when it comes to SLOs.
Are SLOs supposed to be aiming at what the team wants to achieve or rather solid average numbers infrastructure actually shows?
Why not both! Ultimately we talked about what SLOs are and how to create them based on good principles, but something we didn’t define was strict guidelines on exactly how to use them. While we mentioned using them as proactive monitors and building trust in the business, we also mentioned using them as guides for work that needs to be done in upcoming work cycles.
When using them as a guide, this doesn’t necessarily mean that we need to wait for a regression to appear to schedule work - we can also use them as a target. You want to hit a latency target of 800ms but you’re currently 1.2s on average? Use an SLO as a target, and track the history of improvement against it. That said, you can also create an SLO for something closer to your steady state to make sure you aren’t regressing in the meantime!
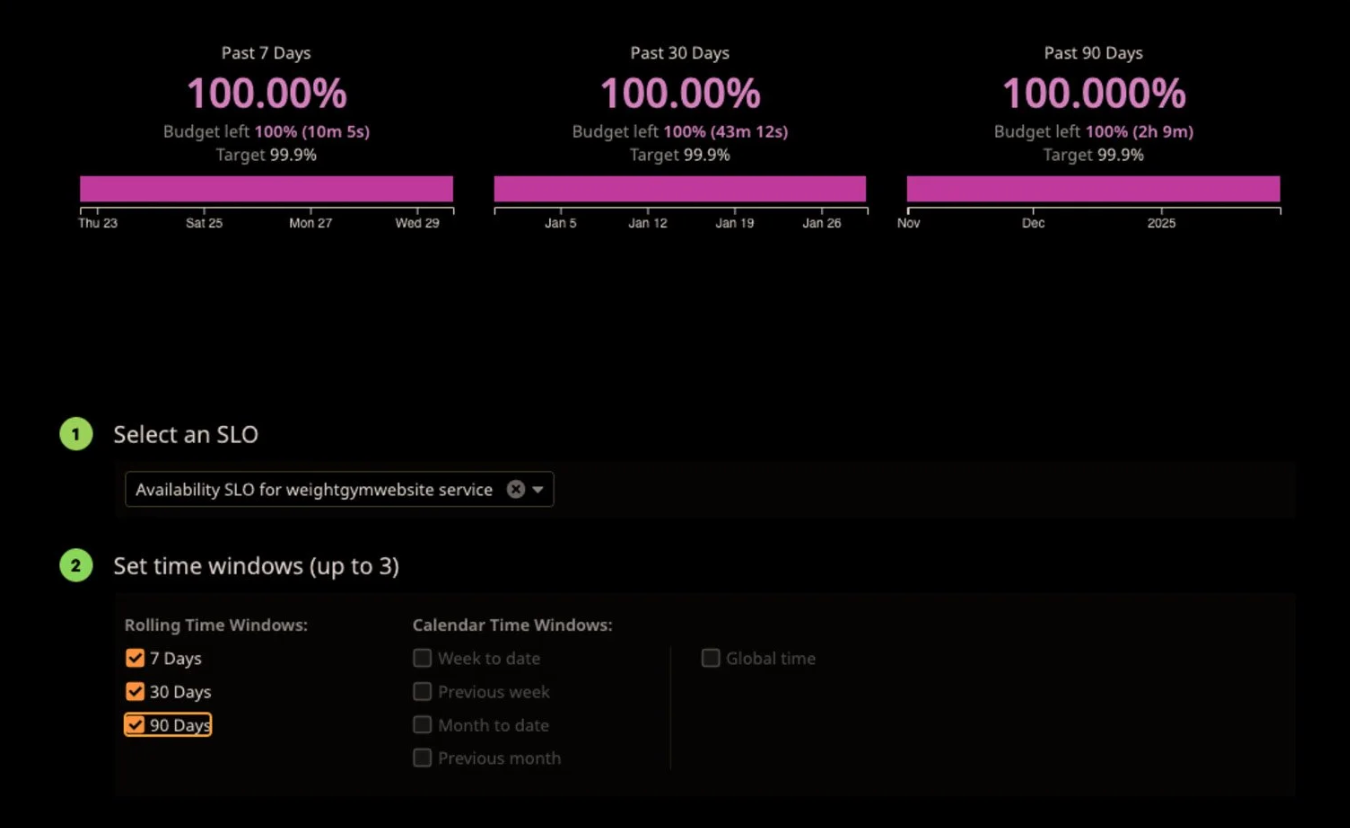
Why would you select 90 days vs 30 days vs 7 days for an SLO?
This is a great question that I wish we had more time to get into. Ultimately I’d say that it comes down to how predictable your state is and exactly how you plan on utilizing SLOs. A 90 day window is good for an organization with well understood patterns and a focus on longer term stability, as well as an organization that has confidence in hitting objectives within that window. It can be used for quarterly stability reviews and executive decisions around direction, since we have a greater view of longer term stability. The downside here is that one major incident can affect the SLO for a longer period of time, of course.
A 30 day SLO is a good balance between longer term trends while also allowing for some variability and a faster reaction time (via a smaller error budget and more apparent burn rate). This is a good balance between ensuring a mid-term customer experience while avoiding overreacting to variability.
A 7 day SLO is good if you have a service that experiences a high deployment velocity or large swings in traffic. This can be a good window for high reactivity to outages, although on the same point this can lead to more noise. This is a good window for orgs with less predictable behavior or teams that are using SLOs for making decisions on paths forward in a more rapid way.
If you still aren’t sure which is right for you, there are two other options - the first is to create 3 SLOs, with each window being represented. The second is to set what you think might be the right window, and use an SLO widget on a dashboard to display all three windows. While you’ll only get alerts for the selected window for the SLO (if you configure alerts), you’ll at least be able to see how you track over time.
What are some weird scenarios you’ve encountered with SLOs and how have you solved for them? Such as the volume of metrics for a journey being fairly low and making SLOs sensitive, or volume varying by time of day so it’s sensitive at night?
This is going to seem like a non-answer at first, but bear with me here. One of the key principles we talked about during the webinar was to start simple; if we have these sorts of questions, we may be overcomplicating things from the start. If that’s not the case, we need to start considering the value of the SLO in the first place. If we have one service that receives 10 requests in a week versus another that receives 1 million, of course one failed request is going to significantly affect an SLO attached to the former more than the latter. The first question I’d ask here is “how important is this app that receives 10 requests”? If it’s business critical, you can't really get out of 1 failed request impacting your error budget by 10%, and your SLO probably should reflect that. If it’s just a very uncommonly used thing that doesn’t really impact much, I’d probably say that we might want to care more about its ability to serve traffic more than we care about how it responds (although this is highly conditional, of course).
I’d probably approach the second part of the question a bit differently, and start by asking why is it more sensitive at night, and how does that impact the SLO overall? Is it because a cache is cold and affects performance and we need to improve that part of the infrastructure? Or, is there a perception that there is a higher error rate at night because (again), one request has knocked out a large portion of the budget. If the answer is more along the lines of the second question here, I’d say that this is probably solved by picking the right time window for your SLO. Remember, we’re talking about a 7 day span of time for SLOs minimum; if we have 1 million requests per day and only 1% of those occur in off-hours, how much does that really affect our SLO across the whole span of time? Probably not a ton! That said, if we notice over time that our SLO is more affected overnight, I’d default back to the question of why and begin addressing that; that’s likely more indicative of a problem with the application or infrastructure more than it is a problem with the SLO.
For creating our first SLOs, what do you recommend?
This answer will largely depend on what exactly you are trying to monitor, of course, but at the end of the day we can still look back to our RED/Golden Signals and start with SLOs for items such as error rate and latency. While a lot of times people immediately associate these two metrics with web servers, we can look back at the definition of these terms and apply them to just about anything. Error rate is the ratio of successful operations to failed operations (operations can be a SQL query, a cache call, submitting to a queue, and so on - not just requests!) and latency is just how long an operation takes (and we can even reuse the examples from error rate). So, we can take error rate and latency and apply it to anything we really care about in one way or another.
These two metrics alone are quite powerful, but a good third option is what people tend to immediately think of when they think of SLOs and percentages - uptime. Most integrations in Datadog return a can_connect or other similar metric that indicates that the Agent can access a database or a webserver; this can immediately be used as a time slice type SLO to monitor when this value is less than 1, indicating downtime of a given instance.
Is it a good approach to create a SLO for a specific use case request traversing many microservices and use tags to group them?
I think this largely depends on how specific the use case actually is. If it is more of a broad ask and we’re looking to create SLOs for many microservices that make up a greater application, then this is simply a problem to solve with tags. For example, let’s say we’re running a retail site and we consider it to be made up of two applications - fulfillment and storefront. The storefront application is made up of the cart, product, and recommendation service. If we apply something like an “application” tag to these instances, we can logically group them together without specifying the many microservices, and holistically look at things like our error rate.

Now, what if the ask wasn’t that simple, and you want to know what is going on as a request takes a specific path through various microservice endpoints, of which there are many. My gut reaction is to say “is this really necessary for an SLO”, but hey, sometimes we have to do things to meet other requirements. With that said, I’d make a small dodge away from the original ask in order to remove some of the complexity that comes with this. Instead of creating a single SLO that attempts to map all of these individual requests and dependencies together into a single measurement, I’d likely break this up into individual SLOs that monitor each service or each specific path independently, and tag the SLO so I could place them all in the same dashboard simply.
“But Nick, you just said to remove the complexity but then also said to make each individual path its own SLO, that sounds like more work”
I sure did! The complexity doesn’t really come from the amount of distinct SLOs here (although, there are some longer term maintenance concerns, for sure), the complexity comes more from the complexity of microservices themselves. If we create a combined SLO that looks for this combination of request patterns, that could change before you even press the save button. However, if we look at each of the required paths on their own, we don’t have to consider the specific path of the entire request, we can simply judge the ability of each individual path to serve traffic properly.
Do you have methods or advice for determining the threshold for SLIs? For example, when looking at historical data should we target to have some amount in the red, using p99 type data, or base it all on engineering application level specs/requirements working backwards from SLAs? How should we go about determining what number to use?
I’m actually going to break this question down into separate questions, because I think some of the points here need to be addressed individually to really answer the primary question
“...should we target to have some amount in the red…”
This goes back to the point of being realistic; realistically, you’re likely to have some periods in the timeline in the red when creating an SLO. This shouldn’t be avoided to make your numbers look better, it should be embraced as a sign of creating something realistic. Should you target it so everything is in the red? Well, if your app isn’t performing well that might not be avoidable, but I wouldn’t intentionally target that. But should you have some? I’d say yes, as that’s likely just reality.
“...using p99 type data…”
Percentile data can be extremely useful when creating SLOs, as they typically represent the worst experiences a customer can have (depending on the data you’re looking at, of course). However, I’d shy away from using such a high distribution. If you have a sample set of 100 users, this only takes one user's experience into account. If this is something like RUM data and they are on a slow machine with an outdated browser and a poor internet connection, this can really skew your results. Instead I’d increase your sample size to something like the P90, as this now represents 10 out of the 100. Whereas a pure average will show the general experience, often the p90+ have way different values. Typically I’d say we should utilize both of these, as neither one tells the full story by itself.
“...or base it all on engineering application level specs/requirements working backwards from SLAs?”
Like we said in the presentation, you can’t have an SLO without an SLI, and you can’t have an SLA without an SLO. If you are creating an SLO to correspond to an SLA, you have violated this rule; how were you previously monitoring your SLA compliance? The SLO over time should inform the SLA, so you know that your SLA to customers is realistic and you aren’t getting yourself into trouble from the start. But, that’s only part of the question; the other part is “should we base it on engineering specs”, and this is a tough one. Sometimes we have specs that we ultimately need to work towards in an iterative fashion, and we might not hit those on first deployment. In this case, an SLO based on that spec can be a target and help measure improvement towards it. What I would say you should do is definitely build your SLOs with an understanding of requirements, and use data based on the current state where you know you can hit or be near your goals, and continue to iterate on the SLOs as things change.
“How should we go about determining what number to use?”
Not to softball this answer, but it definitely goes back to the last part of the last answer - if you need to start somewhere, start with a known steady state number based on the data that you feel confident in hitting, or, set it up to a spec and work towards it.
We are using RUM metrics, particularly latency, for a number of SLIs. Is it a requirement to turn these into custom metrics?
It’s not! Although, you certainly could, particularly if you want to retain this data for the 15 months of Datadog metric retention (but, be careful of your number of dimensions and cardinality while doing this). Another option for creating an SLO based on data that isn’t a time series metric (such as logs, traces, DBM, etc), you can use monitor based SLOs. There are additional considerations to take when using a monitor, however. I wouldn’t advise that you use existing monitors that let you know when there is a problem that you take action on, by that point you have generally avoided the proactive benefits of using SLOs. Instead, I would create a separate monitor with a lower threshold that triggers more often to lean into some of that proactivity, just make sure that it isn’t actually sent to anyone! The other consideration to make here is the window for alerting in your monitor. If your production alert that you act on requires a metric to be in a state for 10 minutes, this is 10 minutes of time that you are not actually affecting the SLO, since a metric based SLO is only affected when the monitor triggers. Instead, I would set the rolling window in the alert to be low, such as a minute, so each occurrence of the threshold violation is more accurately reflected in your SLO value.
When we are running a service on 2 nodes, how should we create an SLO for uptime? Is it a violation of the SLO if one is down or only if both are down?
This ultimately depends on the architecture of the app and how well one node can handle the load of both, leading back to how we think about the user experience. I always think back to the thought experiment of “if a tree falls in the woods and no one is around to hear it, does it make a sound”, because there is actually an answer to this (I promise I’m going somewhere with this) - the definition of sound requires something to actually hear it. So if a tree falls and no one is around, no, it does not make a sound, it creates vibrations in air that would otherwise be perceived as a sound if someone was around. Reeling it back in - apply this to a load balancer - if a node falls out of a load balancer and no one experiences an error, is there a problem? Probably not! But if a bunch fall out, that’s an issue (just like if our tree knocked over other trees and started falling towards someone's house…) and we should know about it. This is all to say - create an SLO for error rate to show if there is an issue when one falls out, but also create one for uptime that shows your downtime when both instances are down.
Can SLOs still be used if we have dynamic based monitors instead of static?
You certainly can, but I would question what this ultimately represents. Anomaly and forecast monitors are great in many cases, but ultimately they reflect when something deviates from a baseline (anomalies) or when something is going to happen (forecast). If you are monitoring for something like traffic anomalies or disk space going to run out soon, is this something that should be the basis for an SLO? If something happens as a result of traffic anomalies, for example, I’d say look back to those symptoms when that does occur for creating an SLO.
Ultimately I think the choice to use anomaly/forecast monitors should force a thinking exercise to see what other symptoms of a problem we can use as something a bit more static for the purposes of an SLO. When this anomaly occurs, what happens and what does a customer experience? Those symptoms would be my targets for an SLO instead. Additionally these symptoms may occur without actually seeing an anomaly, so you also don’t want to be limiting your view via an SLO to only times when this anomaly occurs. Lastly, this partially goes back to the “good, bad, and ugly” slide that talks about what makes a quality SLO - a part of the bad/ugly was creating SLOs off of items that you cannot control. If we’re using anomaly type monitors to detect novel problems or deviations from a baseline, it’s more than likely that it’s because we’re monitoring something that is out of our control, especially in the case of traffic patterns.
If you need help getting your SLOs right –reach out!